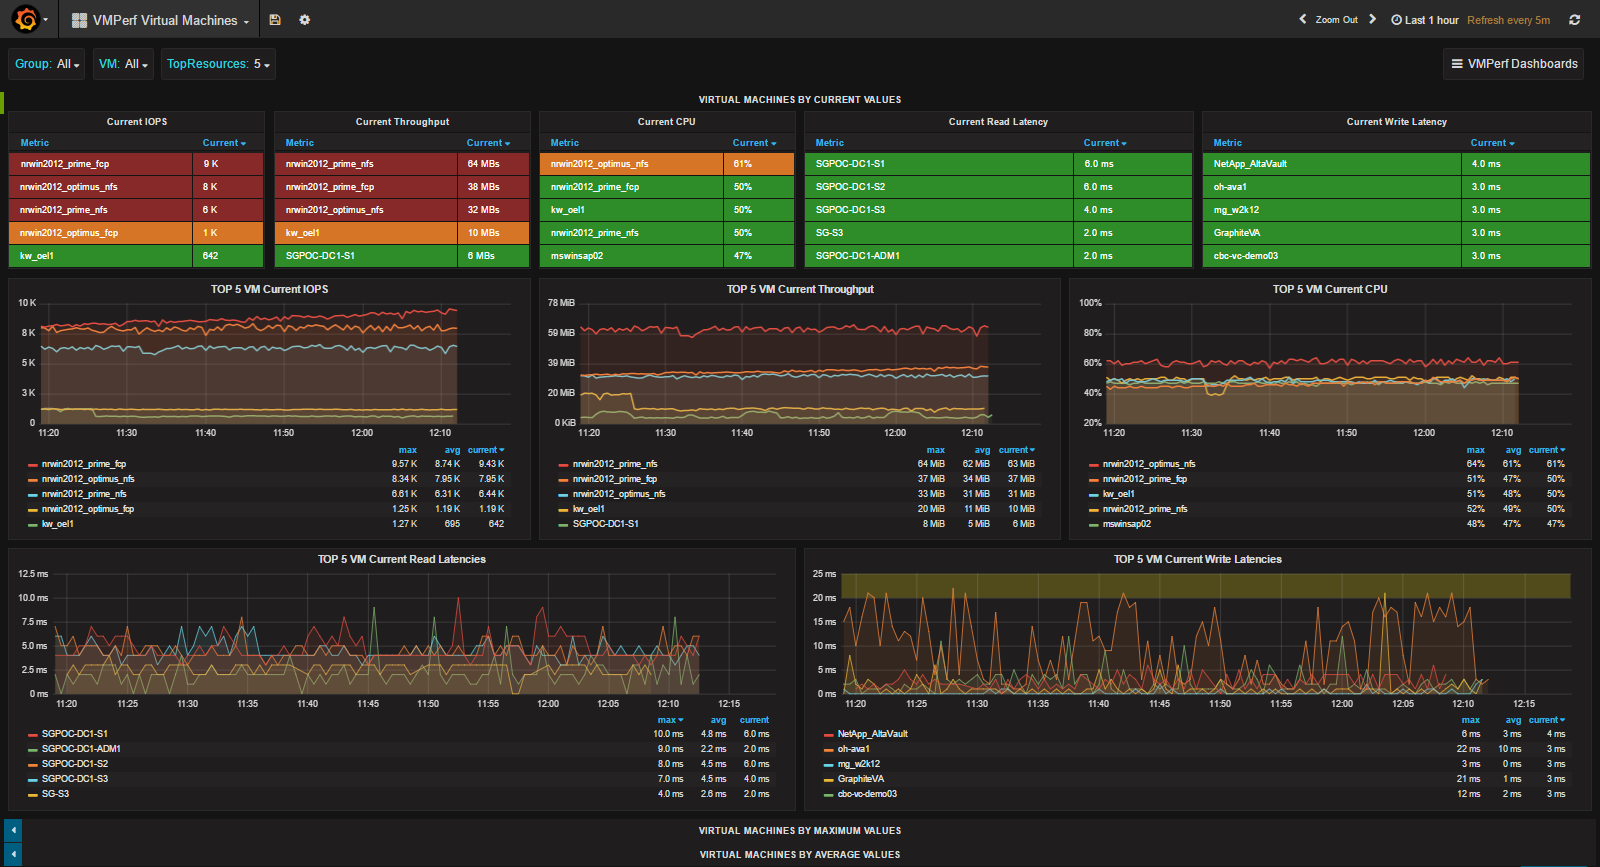
In this article I’ll walk you through setting up VMPerf-To-Graphite PowerShell script written by Matthias and available on GitHub. This will provide the ability to graph metrics such as CPU memory, IOPS, read latency, and write latency on a per-VM basis. It’s extremely useful information that will provide insight for troubleshooting resource contention. And the best part, it’s Open Source.
If you don’t already have Grafana and Graphite, see the article Installing and configuring Grafana on Ubuntu.
There are a few requirements before you will be able to get started.
$PSVersionTable.PSVersion
There’s a small change we’ll need to make to vCenter logging in order to make the most of the script.
This is optional and is not required to collect metrics. By default, Graphite will keep 1 minute of data for 1 day. After 24 hours the data is purged. This may be sufficient for some environments but for others it may defeat the purpose of collecting the metrics. This is easily solved by editing Graphite’s storage-schemas.conf file.
The following steps assume you’re running Ubuntu 14.04 and you had followed the post Installing and configuring Grafana on Ubuntu to install Graphite and Grafana.
sudo nano /etc/carbon/storage-schemas.conf
[vmperf]
pattern = ^vmperf\.
retentions = 60s:1d,5m:7d,15m:35d
Note: The above changes to the storage-schemas.conf file must be completed before collecting statistics using the VMPerf-To-Graphite.ps1 script. Otherwise the metrics will continue to use the [default_1min_for_1day] retention period. The easiest way to resolve this issue is to purge the existing statistics.
sudo rm -rf /var/lib/graphite/whisper/vmperf
The script is available on GutHub. If you don’t already have an account, create one and then follow the project. The VMPerf-To-Graphite script is something you will definitely want to follow once you see just how powerful vCenter Metrics in Grafana can be to your organisation.
.\VMPerf-To-Graphite.ps1 -Verbose
Schedule the script to run automatically using the Windows Task Scheduler. There are many ways to schedule the script as outlined on the GitHub project page but I prefer the following method.
@echo off
REM =============================================================================================================
REM https://github.com/mothe-at/VMPerf-To-Graphite-PowerShell-Script
REM =============================================================================================================
cd /D C:\VMPerf
powershell.exe .\VMPerf-To-Graphite.ps1 -server vcenter.domain.com -user domain\user -password S0m3P@$$w0rd -Graphiteserver graphite.domain.com:2003 -Iterations 1 -Group Default -EventLogLevel Warning -FromLastPoll VMPerf_Default.xml -Verbose >> VMPerf_Default.log 2>&1
Matthias included a JSON file within the GitHub project files. You can use the JSON file to import a dashboard into Grafana. I wasn’t successful with importing the dashboard. What I ended up doing was creating a new dashboard and then I recreated each table and graph by referencing the JSON file. If you want to import the already created dashboard, I suggest making sure that the Graphite data source in Grafana is set to default.
Note: If you attempt importing the JSON file, make sure you’ve set the default data source in Grafana to Graphite. Otherwise you will be forced to edit the data source for each table and graph individually.
A huge thank you to Matthias for building the VMPerf-To-Graphite.ps1 PowerShell script. The script is licensed under a Creative Commons Attribution-NonCommercial-ShareAlike 4.0 International License.
View Comments
Hi,
Can you export your dashboard and give it to me.
It will be very help for me
My email is lalit.eus@outlook.com
Dashboard is available here, https://github.com/mothe-at/VMPerf-To-Graphite-PowerShell-Script/blob/master/VMPerf-Sample-Dashboard.json.